Oct 02, 2018
Google has released their own multifactor authentication hardware tokens: Titan Security Keys. Configuring your Google account to require the hardware keys is typically pretty straightforward but they must be added from a computer. When I was trying from my Linux system the process would always error out, just stating "something went wrong". I eventually found directions from Google that look pretty straight forward, but did not resolve the issue. Turns out a few tweaks were required.
Official Method
The initial directions as listed are as follows:
- Create a file called
/etc/udev/rules.d/titan-key.rules
- Populate the file with the following:
KERNEL=="hidraw*", SUBSYSTEM=="hidraw", ATTRS{idVendor}=="18d1", ATTRS{idProduct}=="5026", TAG+="uaccess"
- Save
- Reboot
Troubleshooting
Even after following the above, I was getting the same error. Looking more closely at the rule as configured gave me some clues as to why. Essentially, the rule as written says that when a device is inserted that has a vendorID of 18d1 and a productID of 5026, add the "uaccess" tag. This allows Chrome to communicate directly with the USB device. That is required by since FIDO U2F, the protocol in use, actually utilizes the URL when creating the challenge–response authentication request. Plugging a key in and checking dmesg reveals the issue:
[ 5866.626801] usb 1-2: new full-speed USB device number 16 using xhci_hcd
[ 5866.775955] usb 1-2: New USB device found, idVendor=096e, idProduct=0858, bcdDevice=44.00
[ 5866.775962] usb 1-2: New USB device strings: Mfr=1, Product=2, SerialNumber=0
[ 5866.775966] usb 1-2: Product: U2F
[ 5866.775969] usb 1-2: Manufacturer: FT
Checking both keys from the set I received confirmed that neither the vendor or product matches Google's documentation. This makes some sense as the keys are actually manufactured by a company called Feitian with Google's own firmware.
After looking at a few different articles I found you can configure udev rules to match multiple options in a given field. Additionally, my version of udev did not seem to recognize rules unless the file name was prefixed with a number.
Fixed Directions
- Create a file called
/etc/udev/rules.d/70-titan-key.rules
- Populate with the following:
KERNEL=="hidraw*", SUBSYSTEM=="hidraw", ATTRS{idVendor}=="18d1|096e", ATTRS{idProduct}=="5026|0858|085b", TAG+="uaccess"
- Save
- Run
sudo udevadm control --reload-rules
Provisioning the key should now work from your Linux machine.
These directions were tested and confirmed working on openSUSE Tumbleweed with udev version 237. Additional tweaking may be required for other versions of udev.
Click to read and post comments
Jan 07, 2017
While rearranging my storage configuration in my homelab, I ran into a situation where I wanted to redo the layout of a fully provisioned Synology NAS. In this case, all disks were used in a single RAID 6 array, giving a two disk fault tolerance. I had already cleared off the majority of the data, with just enough left over to fit on a single disk from the array. I figured the easiest solution would be to remove a disk from the array, move the data there, then rebuild with a different configuration. Luckily, Synology uses mdadm under the hood in basic RAID types (their SHR may be different, I haven't looked into it yet). Here's how to remove a disk.
The following is 100% not supported in any way by Synology. It involves intentionally compromising the integrity of your RAID array, greatly putting your data at risk. All data should be backed up before attempting any of the following. No seriously, you'll probably lose your data.
First, ensure SSH is enable and connect as a user with administrative privileges. The following commands will need to be run as root, so utilize sudo before each.
This will result in a list of arrays similiar to the following:
ARRAY /dev/md2 metadata=1.2 name=<nashostname>:2 UUID=d5c56c64:eebd794f:1ac841a5:89891531
Make sure you pick the correct array from the disk and run the detail command again against the specific array to get extended details including what disks are included.
# mdadm --detail /dev/md3
/dev/md3:
        Version : 1.2
  Creation Time : Thu Jan 12 09:30:52 2017
     Raid Level : raid6


--clip--


    Number   Major   Minor   RaidDevice State
       0       8        3        0      active sync   /dev/sda3
       1       8       19        1      active sync   /dev/sdb3
       2       8       35        2      active sync   /dev/sdc3
       3       8       51        3      active sync   /dev/sdd3
Before a disk can be removed from an array it must be marked as failed so choose a disk and fail it out
# mdadm --fail /dev/md3 /dev/sdd3
At this point your NAS should start beeping like crazy to tell you that you have a failed drive. For the sake of your sanity, you probably want to go clear the beep message. Now, the drive can be removed from the array.
# mdadm --remove /dev/md3 /dev/sdd3
If you log back into DSM you should have a disk available for use. In my case I formatted it as a basic disk, copied the shares over, then converted to a RAID 1 then to RAID 5 as disks became available from the rest of the rebuild process.
Click to read and post comments
Aug 16, 2016
I decided to try out CloudFlare on this blog to get a better understanding of how it works. The site was already protected with an SSL certificate from (the very awesome) Let's Encrypt service. CloudFlare also gives you a free SSL when you route your site through them, but I wanted to ensure that traffic was fully encrypted end-to-end. The Let's Encrypt Auto script could no longer verify the site via direct IP connection since it is masked by CloudFlare. Luckily the script is also able to verify ownership by looking at a special page it generates when using the webroot option. I just had to make sure the files were accessible properly.
I am using NGINX to serve the content from Ghost. I didn't feel like digging into Ghost to figure out if it would be possible to serve the transient files that the script creates. Luckily, this task is easy with NGINX.
Here's the relevant snippet before the change:
server {
        listen 443 ssl;
        server_name blog.reboost.net;
        ssl_certificate /etc/letsencrypt/live/blog.reboost.net/fullchain.pem;
        ssl_certificate_key /etc/letsencrypt/live/blog.reboost.net/privkey.pem;


        location / {
                proxy_set_header  X-Real-IP $remote_addr;
                proxy_set_header   Host    $http_host;
                proxy_set_header X-Forwarded-Proto $scheme;
                proxy_pass        http://127.0.0.1:2368;

        }

}
The auto renew script creates folder called .well-known (so http://example.com/.well-known/<unique renewal key>).
Simply adding a new more specific location tag will do the trick:
server {
        listen 443 ssl;
        server_name blog.reboost.net;
        ssl_certificate /etc/letsencrypt/live/blog.reboost.net/fullchain.pem;
        ssl_certificate_key /etc/letsencrypt/live/blog.reboost.net/privkey.pem;

        location /.well-known {
                root /var/www/;
        }

        location / {
                proxy_set_header  X-Real-IP $remote_addr;
                proxy_set_header   Host    $http_host;
                proxy_set_header X-Forwarded-Proto $scheme;
                proxy_pass        http://127.0.0.1:2368;

        }

}
Now, the following command can be run to renew any certificates on the server:
letsencrypt-auto renew --webroot --webroot-path /var/www
Mar 16, 2016
Introduction
Suricata is an excellent Open Source IPS/IDS. While there is an official package for pfSense, I found very little documentation on how to properly get it working. Furthermore, there does not appear to be any native functionality to ship the logs it generates to alternative collectors, other than through syslog which I am already exporting to other sources. Below I will detail the steps I performed to get Suricata to ship logs a server running the ELK stack.
Technologies in use:
-
pfSense - Fully featured open source firewall based on FreeBSD. Will act as the edge device and integrated Suricata host. As of this writing, the latest version is 2.2.6 using FreeBSD 10.1.
-
Suricata - Open Source IPS/IDS to collect and analyze data to look for possible security risks in the network.
-
ELK Stack - Comprised of Elasticsearch, Logstash, and Kibana. Absolutely fantastic suite of tools for centralizing, analyzing, and visualizing logs. Elasticsearch is used for log storage and search, Logstash for processing the logs into a digestible format for Elasticsearch to consume, and Kibana acts a front end for easy search and visualization. This will run on a separate server from pfSense within the network.
-
Filebeat - Tool for shipping logs to Elasticsearch/Logstash. Will run from pfSense and look for changes to the Suricata logs.
Warning:
It is worth mentioning that I am by no means knowledgeable on FreeBSD (I'm really more of a Linux guy), so there are likely things that are not done to best practices. Furthermore, this procedure involves installing unofficial software on pfSense which is absolutely not supported. It is also worth pointing out that while pfSense is generally very light on resources, Suricata increases utilization by a good bit.
pfSense and ELK Setup
I will not be diving into the actual setup of either pfSense or an ELK server and assume both are already operational. pfSense has a good getting started guide here, while I found DigitalOcean's ELK guides for Ubuntu and CentOS to be very helpful. Elastic's official documentation is also great.
Suricata Setup
Install
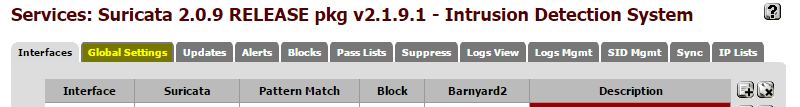
In the pfSense web interface, select System->Packages. Open the Available Packages tab, Suricata can be found under the Security tab. Use the plus sign on the right side to begin the install. Once complete, Suricata's settings can be accessed from the Services menu. First stop is the Global Settings tab.
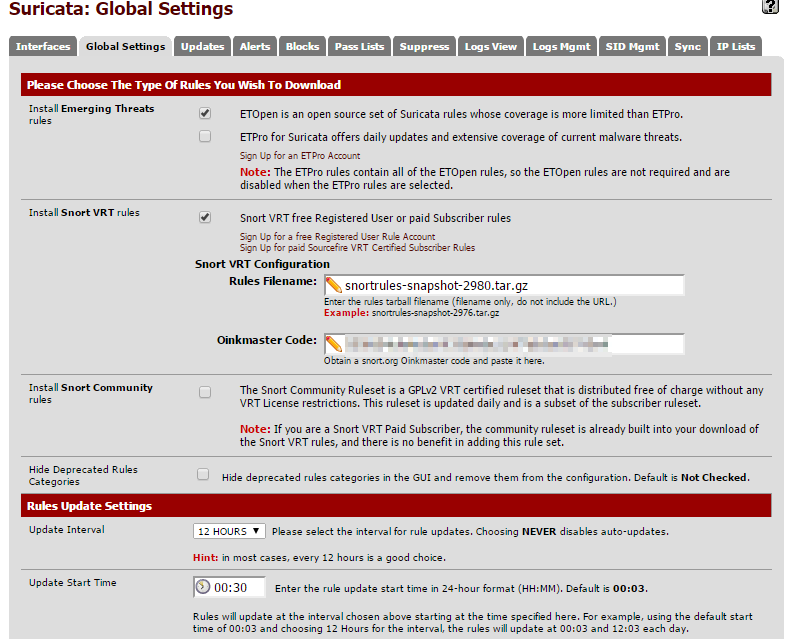
Configure Rules
Suricata uses downloaded rule sets to determine when to alert. There are two different types of rules that can be set up from this screen:
-
Emerging Threats (now owned by ProofPoint) - This comes in a (free) Open Source version and Pro version which requires a subscription. The free version is more limited than the paid version, but still very robust. To enable, just check the box next to the Open Source version.
-
Snort - Snort is another Open Source IDS product, similar to Suricata, now owned by Cisco. Rules for Snort will work with Suricata. There are several tiers of rule set available ranging from a totally open set, to a set that requires registration and a handful of high paid tiers. The more expensive tiers get new rules sooner. Use the links to sign up for an account at the desired price level and enter the name of the file that can be found after signing in. Suricata also requires your Oinkmaster Code which can be found in your profile after signing up. Check the box to enable Snort rules. If you just want to use the community rules, just check the third box.
Set the Automatic Update to field to 12 hours and hit save at the bottom of the screen.
Now move on to the update tab to kick off the initial download of the selected rule sets. Just the hit update button and wait for everything to finish.
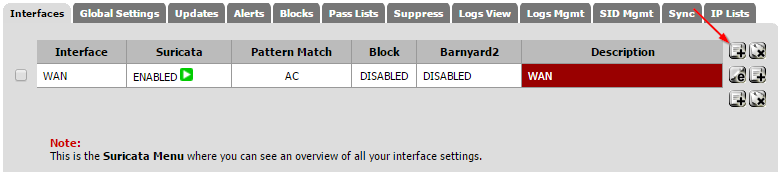
Configure An Interface
Now jump back to the interface tab. Click on the Add Interface Mapping button on the right side.
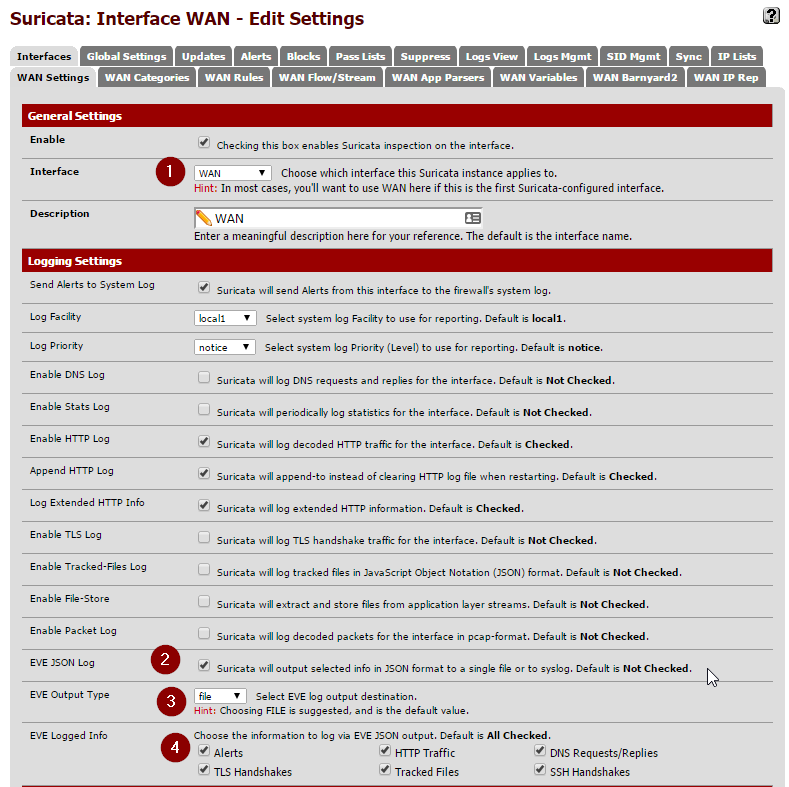
Pick your WAN interface in the drop down. The majority of the other settings can be left at their defaults. Now check off the EVE JSON Log setting. Make sure the Eve Output Type is left one "file" and all of the check boxes in Eve Logged Info boxes are checked off. For now, make sure both settings under Alert Settings are unchecked. This can be used to automatically kill sessions that match one of the rules we will be applying, but its best to let things run for a few days to ensure everything is operating as expected. Save the settings.
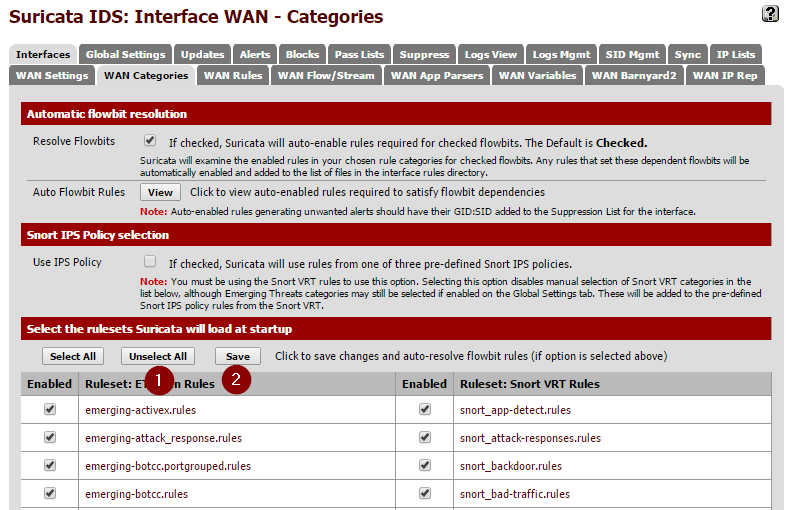
Now to apply the rules we downloaded to this interface. This is done in the Categories tab. When you open this section you should see all of the rules that were downloaded and extracted earlier. Simply hit the Select All then Save.
Next, check out the Rules section. This is where you can tweak which specific rules from the extract sets actually alert. For now you can just leave everything enabled. I did end up disabling rules under the decoder-events.rules and stream-event.rules. These seemed to create a lot of noise for things that didn't really appear to be issues related to low-level network behaviors. These events can be filtered from views in Kibana, but I found it easier just to disable them at the source.
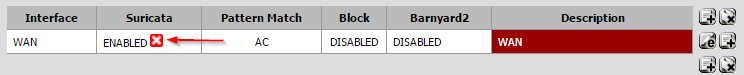
After everything is set, got back to the Interfaces page. If there is a red X in the Enabled section, click it to start inspection. It should to a green check mark after a few seconds.
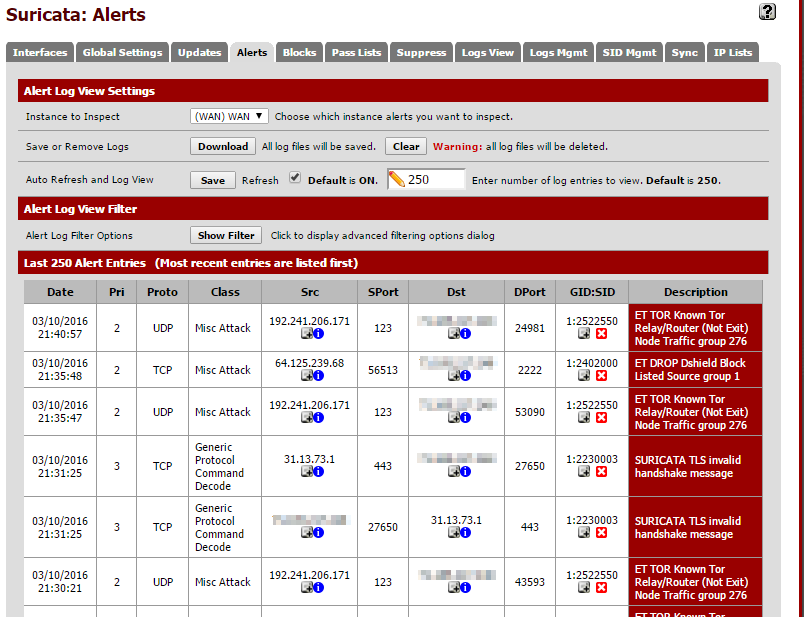
In few minutes, you should start to events that match an applied rule show up in the Alerts tab.
At this point, everything should be running that we need to on the Suricata side of things. Now its time to set up Filebeat to forward logs to an ELK server.
Filebeat Installation/Configuration
There is no official package from pfSense for Filebeat. In order to install it, you will need to manually download to package and set it to run on boot. This must be done from an shell session. If you have not already done so, enable SSH and get logged into the shell (8 from the main menu).
Find the package
Elastic does not officially release FreeBSD variants of Filebeat. Luckily their build system produces new releases automatically. You just have to find the latest release.
First, find the hash of the latest push to the master branch. I did this from another machine:
curl -XGET https://api.github.com/repos/elastic/beats/git/refs/heads/master
You will get a JSON array back. Look for the sha field under object.
{
  "ref": "refs/heads/master",
  "url": "https://api.github.com/repos/elastic/beats/git/refs/heads/master",
  "object": {
    "sha": "e84484e5b5dd09caf159f83c2c8359c5e988b3b4",
    "type": "commit",
    "url": "https://api.github.com/repos/elastic/beats/git/commits/e84484e5b5dd09caf159f83c2c8359c5e988b3b4"
  }
}
Now find the corresponding build on this page. You want the filebeat-freebsd-amd64 package. Copy the URL then fetch it right on your pfSense box.
cd ~
fetch https://beats-nightlies.s3.amazonaws.com/jenkins/filebeat/321-e84484e5b5dd09caf159f83c2c8359c5e988b3b4/filebeat-freebsd-amd64
Move filebeats to where we'll run it out of and ensure it is executable:
mkdir /etc/filebeat
mv ~/filebeat-freebsd-amd64 /etc/filebeat/
chmod +x /etc/filebeat/filebeat
Configure Filebeat
By default, Filebeat will look in its current directory for a configuration file called filebeat.yml. An example configuration can be found here. Ultimately we just need to ship any EVE files so the configuration will be fairly minimal, but first we need to find where those files are located. Generally, they seem to be located in /var/log/suricata/<interface_name>/eve.json but you can also locate them with:
The contents of /etc/filebeat/filebeat.yml should be:
filebeat:
  prospectors:
    -
      paths:
        - /var/log/suricata/*/eve.json
      input_type: log
      document_type: SuricataIDPS
output:
  logstash:
    hosts: ["192.0.2.15:5044"]
Replace hosts with the IP address or host name of your Logstash server. Remember that white space is significant in YAML and tabs are not allowed. This is about as simple a configuration that you can get away with but there is much more that can be configured from here. Make note of the document_type field, which will be used in some Logstash filters later. Test for syntax errors with:
/etc/filebeat/filebeat -configtest
It will return nothing if the config file is properly formatted.
Set Filebeat To Start Automatically
The easiest way to set Filebeat to start at boot is to add a shellcmd to pfSense's config. Per the official documentation there are two ways to accomplish this: manually editing the config or via an installable package. I had a lot of issues when doing it manually, so the package route seems like the better way to go.
Navigate to System, Packages in the pfSense menu and locate the Shellcmd package. Click on the Plus sign on the right to kick off the install. Once complete, the package can be configured via the Services menu. Click the plus sign to add a new command. In the Command box enter /etc/filebeat/filebeat. Leave the type box as shellcmd. Save the configuration. You will need to restart for Filebeat to begin running in the background.
Logstash Configuration
Now we're going to jump over to the ELK server. Before we get into the actual configuration, let's grab a geolocation dataset that we be useful for mapping IP addresses to locations on a map. I generally just store it in the Logstash directory:
cd /etc/logstash
wget http://geolite.maxmind.com/download/geoip/database/GeoLiteCity.dat.gz
gzip -d GeoLiteCity.dat.gz
Logstash configurations consists of three parts:
- An input, where to accept the stream for the log. In our case it will be a port to receive the Filebeat traffic.
- A filter, used to transform the data so that it is ready to be placed in the output source. Since Suricata is already outputting JSON the only thing that is really being done is a look up of the IP address against the geolocation database we downloaded earlier.
- An output, where to store the data. In this case, the Elasticsearch instance.
All of these could be defined in a single file but it is much more manageable to split them into separate files. Create and populate the following under /etc/logstash/conf.d:
Input file:
01-beatin.conf
input {
  beats {
    port => 5044
    codec => json
  }
}
Filter (make sure the path to the geo data matches):
10-suricata.conf
filter {
  if [type] == "SuricataIDPS" {
    date {
      match => [ "timestamp", "ISO8601" ]
    }
    ruby {
      code => "if event['event_type'] == 'fileinfo'; event['fileinfo']['type']=event['fileinfo']['magic'].to_s.split(',')[0]; end;"
    }
  }

  if [src_ip]  {
    geoip {
      source => "src_ip"
      target => "geoip"
      #database => "/etc/logstash/GeoLiteCity.dat"
      add_field => [ "[geoip][coordinates]", "%{[geoip][longitude]}" ]
      add_field => [ "[geoip][coordinates]", "%{[geoip][latitude]}"  ]
    }
    mutate {
      convert => [ "[geoip][coordinates]", "float" ]
    }
    if ![geoip.ip] {
      if [dest_ip]  {
        geoip {
          source => "dest_ip"
          target => "geoip"
          #database => "/etc/logstash/GeoLiteCity.dat"
          add_field => [ "[geoip][coordinates]", "%{[geoip][longitude]}" ]
          add_field => [ "[geoip][coordinates]", "%{[geoip][latitude]}"  ]
        }
        mutate {
          convert => [ "[geoip][coordinates]", "float" ]
        }
      }
    }
  }
}
Output:
30-elasticout.conf
output {
  elasticsearch {
    host => localhost
  }
}
Now check the configuration, on Ubuntu 14.04 it is done with the following command:
service logstash configtest
The command should return Configuration OK if everything is good. Restart Logstash with service logstash restart to make sure it picked up the configuration changes.
You should now be able to see the events from Suricata in Kibana:
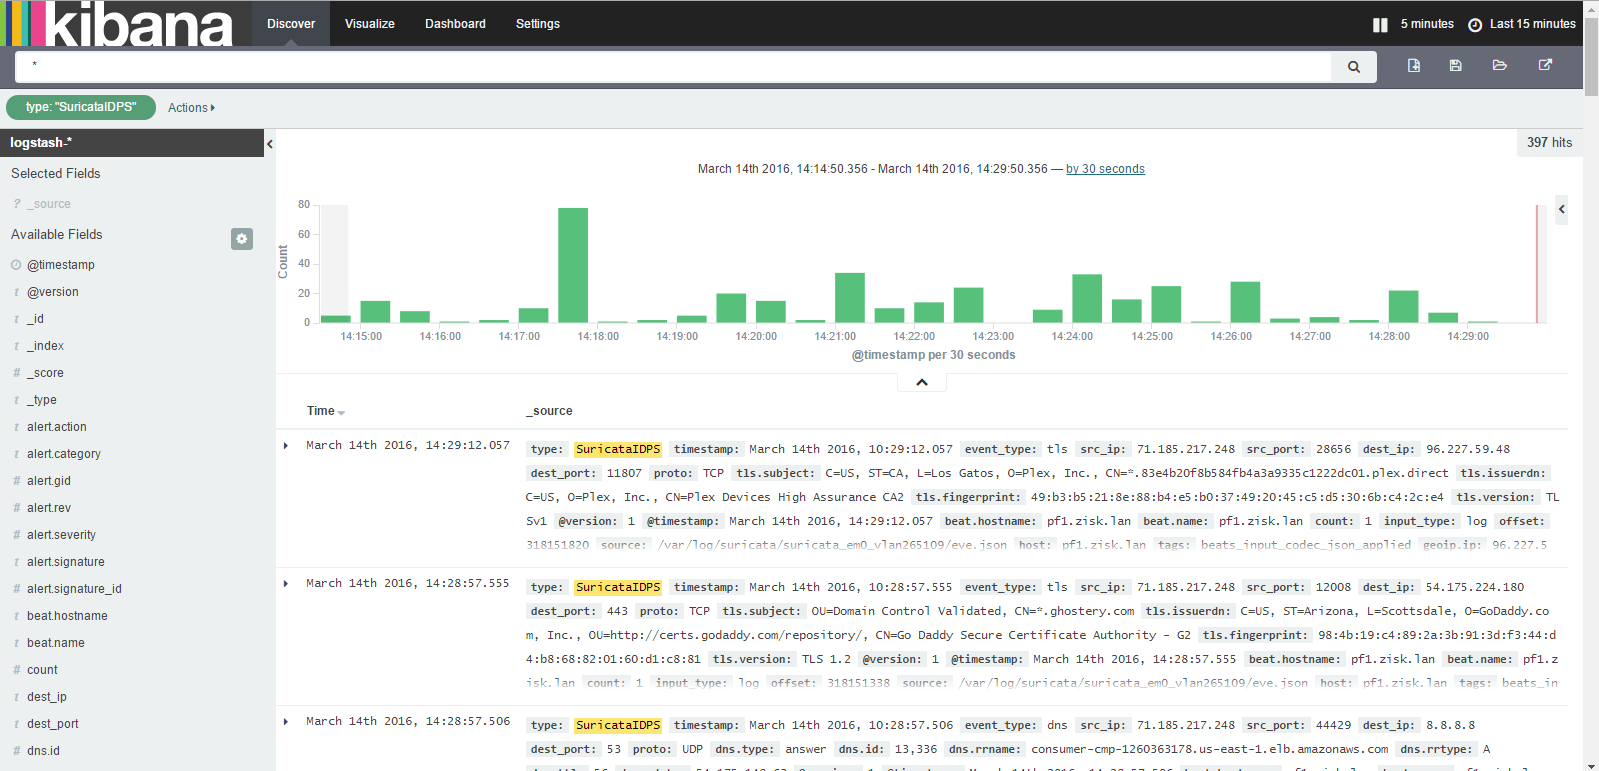
With the default configuration there is quite a bit logged since DNS and TLS connects are both included, but these can be filtered out by setting the event_type to alert.
Notes
-
I did not set up any security for Filebeats during this tutorial, but it is recommended that you set up encryption, which is detailed in the DigitalOcean tutorial above. Elastic also makes a product called Shield, which I have not tried yet but is used for securing various parts of the ELK stack.
-
I don't know if its necessary but I did set up Logrotate to cycle the EVE files when they get too large. This can be installed using the pkgcommand on pfSense. I used the following config and setup a daily cronjob:
/var/log/suricata/*/eve.json {
        size 500M
        rotate 0
        missingok
        postrotate
                killall -HUP suricata
        endscript
}
- I have not set up any sort of maintenance on the Elasticsearch instance so records will keep getting added until it fills the disk. I am going to look at Curator for this.
Click to read and post comments
Dec 17, 2015
One of the best new features in Windows 10 is the upgrade to Powershell 5. Along with a ton of useful new cmdlets (like Invoke-WebRequest), you can now expand zip files natively. The Archive Module actually includes both compression and expansion cmdlets, but I found the unzipping tool the be the most useful for quick one liners.
In its most basic form, simply call Expand-Archive and the path to the archive to expand to the current directory. However, things get interesting when you string commands together. For example, this will recursively unzip every archive in a directory tree to its current folder and delete the original archive:
Get-ChildItem -Recurse -Filter *.zip $path | \
%{ Expand-Archive -Path $_.FullName -DestinationPath $_.DirectoryName; Remove-Item $_.FullName }
Dec 07, 2015
I was recently testing the idea of using a Raspberry Pi to run a Dashing dashboard on a TV. I found several tutorials for kiosk style displays using Raspbian Wheezy but had some trouble getting everything to work on Jessie. I was eventually able to get everything operational with only a few tweaks.
Setup
Follow the standard procedure to get Raspbian on the Pi's SD card. I used the full Raspbian image since I would need a windows manager in order to launch Chrome but a lighter setup is probably possible with the "lite" distribution.
After your Raspberry Pi is booted, SSH in. First, make sure everything is up to date:
sudo apt-get update && sudo apt-get -y upgrade
Then run raspi-config. Do some of the standard system configuration:
- Expand the file system from the main menu.
- Change the pi user's password.
- Disable overscan from the advanced menu. This will help ensure the display fills the entire screen on the TV.
- If not already enabled change the default boot option to launch to GUI and login as the pi user.
Restart.
Install unclutter which hides the mouse cursor.
sudo apt-get install unclutter
Chromium
One roadblock I ran into is the fact that Chromium (the open source project Google Chrome is based on) is no longer in the official repos for Raspberry Pi. It seems as though the project stopped auto-generating ARM builds at some point. I saw some suggestions to use iceweasel, the Debian fork of Firefox, but it lacks the ability to specify launch options. All of the suggested methods of getting it to run full screen, typically using plugins, seemed hacky. I wanted to be able to configure everything from SSH if possible.
Luckily I found this blog post that points out that the Ubunutu folks have been generating compatible builds. You will need to grab three packages from the Launchpad repos: libgcrypt11, Chromium, and Chromium codecs. Click on the latest build number and find the link for the deb file then wget them down to the Pi and install. For example:
wget http://launchpadlibrarian.net/201290259/libgcrypt11_1.5.3-2ubuntu4.2_armhf.deb
wget http://launchpadlibrarian.net/219267135/chromium-codecs-ffmpeg-extra_45.0.2454.101-0ubuntu0.14.04.1.1099_armhf.deb
wget http://launchpadlibrarian.net/219267133/chromium-browser_45.0.2454.101-0ubuntu0.14.04.1.1099_armhf.deb

sudo dpkg -i libgcrypt11_1.5.3-2ubuntu4.2_armhf.deb
sudo dpkg -i chromium-codecs-ffmpeg-extra_45.0.2454.101-0ubuntu0.14.04.1.1099_armhf.deb
sudo dpkg -i chromium-browser_45.0.2454.101-0ubuntu0.14.04.1.1099_armhf.deb
Autostart Settings
Raspbian uses LXDE for its desktop environment. You can set application to automatically launch right from the autostart config file. Many of the Wheezy tutorials I found suggested modifying the global file but that does not appear to work in Jessie. Instead modify the file found in the pi user's home directory:
vi /home/pi/.config/lxsession/LXDE-pi/autostart
Comment out the following line to disable the screensaver by adding a # to the beginning:
@xscreensaver -no-splash
Under that line add the following xset options to disable some of the power saving settings and ensure the screensaver is truly off:
@xset s off
@xset s noblank
@xset -dpms
Now, add a line to launch Chromium in kiosk mode. Obviously you'll want to fill in your own URL at the end:
@chromium-browser --noerrdialogs --kiosk --incognito https://news.google.com
Now reboot and you should see the desktop auto-launch followed shortly by a full screen Chromium window.
Additional Sources
https://www.danpurdy.co.uk/web-development/raspberry-pi-kiosk-screen-tutorial/
https://www.raspberrypi.org/forums/viewtopic.php?f=36&t=122444
http://toxaq.com/index.php/2012/12/running-shopifys-dashing-on-a-raspberry-pi/
Click to read and post comments
Oct 15, 2015
I recently had an issue with a Linux VM that was configured with LVM. The server had run out of space several times and each time it did someone simply added a new primary partition, formatted it to LVM and extended the logical volume. This was all well and good until the 3rd time the server ran out of space. We could no longer add any more partitions to the drive. Worse, the way the layout was done gparted was having issues even extending the existing partitions. For the sake of simplicity, I decided to just reconfigure the entire partition scheme back to a single partition to ease future growth. Luckily this can be done fairly easily with logical volume mirroring.
I re-created the scenario in my lab to test possible solutions. The following ended up working perfectly. In this example there are only three existing partitions but the same process could be used for more, even if the partitions are split across multiple physical drives.
Run pvs to see the current physical volumes:
# pvs

PV         VG     Fmt  Attr PSize  PFree
/dev/sda3  lvm-vg lvm2 a--   4.54g    0
/dev/sda4  lvm-vg lvm2 a--   4.46g    0
/dev/sda5  lvm-vg lvm2 a--  15.76g    0
As you can see, the volume group "lvm-vg" is split across three partitions (physical volumes or PVs) with no free space on any.
Add a second hard drive (this machine is virtual so it was trivial), and format with a single primary partition and LVM as the filesystem.
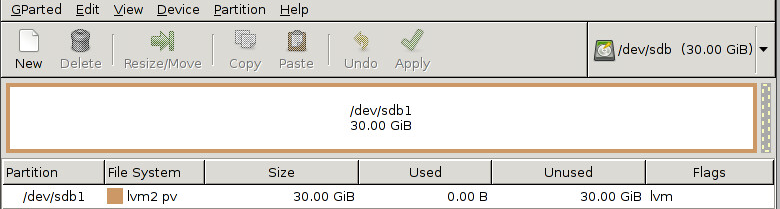
Now, back in the OS, the new disk shows up in the list of physical volumes but has not yet been added to any volume groups.
# pvs
  PV         VG     Fmt  Attr PSize  PFree
  /dev/sda3  lvm-vg lvm2 a--   4.54g     0
  /dev/sda4  lvm-vg lvm2 a--   4.46g     0
  /dev/sda5  lvm-vg lvm2 a--  15.76g     0
  /dev/sdb1         lvm2 a--  30.00g 30.00g
Use vgextend to add the new physical disk to the volume group.
vgextend lvm-vg /dev/sdb1
Now to convert the volume group "lvm-vg" to a mirrored volume. The command to this is lvconvert. Because all of the free space exists only on the new physical volume, that will be used as the mirror. Note that this will have to be done for each logical volume under the volume group. In my case, the root file system and swap. Each step takes quite a while as all data is mirrored.
lvconvert -m 1 /dev/lvm-vg/root
lvconvert -m 1 /dev/lvm-vg/swap_1
Once the mirror has been established, use lvconvert with with the -m 0 option, specifying which partitions are to be removed.
lvconvert -m 0 /dev/lvm-vg/root /dev/sda3 /dev/sda4 /dev/sda5
lvconvert -m 0 /dev/lvm-vg/swap_1 /dev/sda3 /dev/sda4 /dev/sda5
The output of pvs should now show the free space on the partitions that were removed.
# pvs

  PV         VG     Fmt  Attr PSize  PFree
  /dev/sda3  lvm-vg lvm2 a--   4.54g  4.54g
  /dev/sda4  lvm-vg lvm2 a--   4.46g  4.46g
  /dev/sda5  lvm-vg lvm2 a--  15.76g 15.76g
  /dev/sdb1  lvm-vg lvm2 a--  30.00g  5.24g
Now remove each of the partitions from the volume group entirely with vgreduce.
vgreduce lvm-vg /dev/sda3
Re-partition the first disk in a more sane fashion. I did it in a gparted to be safe but everything could be done from fdisk within the live operating system. In the end, I ended up with an extended partition with a lvm formatted logical volume beneath it.
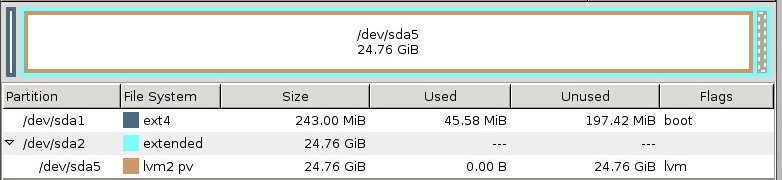
After the primary drive is done being partitioned, repeat the process to copy everything back to that volume then remove the staging drive. Now the system is on a nice continuous partition on a single drive that can be managed more easily moving forward. Make sure to resize the root filesystem once its in its final home.
Some pages that led me in the right direction:
-
Server Fault post
-
LVM Cluster on CentOS
Click to read and post comments