Suricata on pfSense to ELK Stack
Introduction
Suricata is an excellent Open Source IPS/IDS. While there is an official package for pfSense, I found very little documentation on how to properly get it working. Furthermore, there does not appear to be any native functionality to ship the logs it generates to alternative collectors, other than through syslog which I am already exporting to other sources. Below I will detail the steps I performed to get Suricata to ship logs a server running the ELK stack.
Technologies in use:
-
pfSense - Fully featured open source firewall based on FreeBSD. Will act as the edge device and integrated Suricata host. As of this writing, the latest version is 2.2.6 using FreeBSD 10.1.
-
Suricata - Open Source IPS/IDS to collect and analyze data to look for possible security risks in the network.
-
ELK Stack - Comprised of Elasticsearch, Logstash, and Kibana. Absolutely fantastic suite of tools for centralizing, analyzing, and visualizing logs. Elasticsearch is used for log storage and search, Logstash for processing the logs into a digestible format for Elasticsearch to consume, and Kibana acts a front end for easy search and visualization. This will run on a separate server from pfSense within the network.
-
Filebeat - Tool for shipping logs to Elasticsearch/Logstash. Will run from pfSense and look for changes to the Suricata logs.
Warning: It is worth mentioning that I am by no means knowledgeable on FreeBSD (I'm really more of a Linux guy), so there are likely things that are not done to best practices. Furthermore, this procedure involves installing unofficial software on pfSense which is absolutely not supported. It is also worth pointing out that while pfSense is generally very light on resources, Suricata increases utilization by a good bit.
pfSense and ELK Setup
I will not be diving into the actual setup of either pfSense or an ELK server and assume both are already operational. pfSense has a good getting started guide here, while I found DigitalOcean's ELK guides for Ubuntu and CentOS to be very helpful. Elastic's official documentation is also great.
Suricata Setup
Install
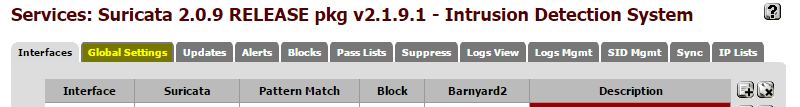
In the pfSense web interface, select System->Packages. Open the Available Packages tab, Suricata can be found under the Security tab. Use the plus sign on the right side to begin the install. Once complete, Suricata's settings can be accessed from the Services menu. First stop is the Global Settings tab.
Configure Rules
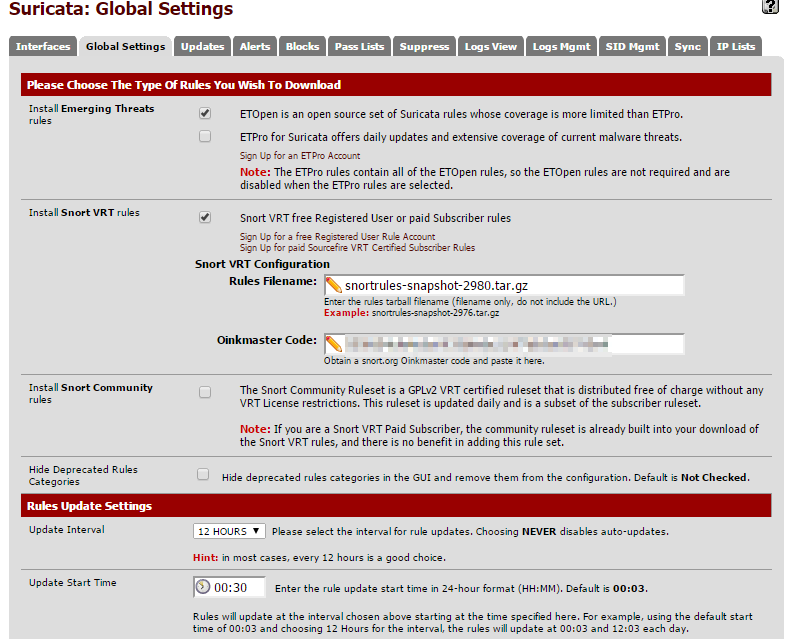
Suricata uses downloaded rule sets to determine when to alert. There are two different types of rules that can be set up from this screen:
-
Emerging Threats (now owned by ProofPoint) - This comes in a (free) Open Source version and Pro version which requires a subscription. The free version is more limited than the paid version, but still very robust. To enable, just check the box next to the Open Source version.
-
Snort - Snort is another Open Source IDS product, similar to Suricata, now owned by Cisco. Rules for Snort will work with Suricata. There are several tiers of rule set available ranging from a totally open set, to a set that requires registration and a handful of high paid tiers. The more expensive tiers get new rules sooner. Use the links to sign up for an account at the desired price level and enter the name of the file that can be found after signing in. Suricata also requires your Oinkmaster Code which can be found in your profile after signing up. Check the box to enable Snort rules. If you just want to use the community rules, just check the third box.
Set the Automatic Update to field to 12 hours and hit save at the bottom of the screen.
Now move on to the update tab to kick off the initial download of the selected rule sets. Just the hit update button and wait for everything to finish.
Configure An Interface
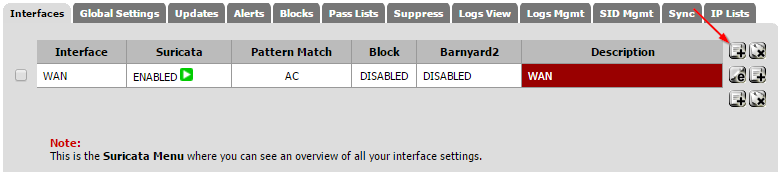
Now jump back to the interface tab. Click on the Add Interface Mapping button on the right side.
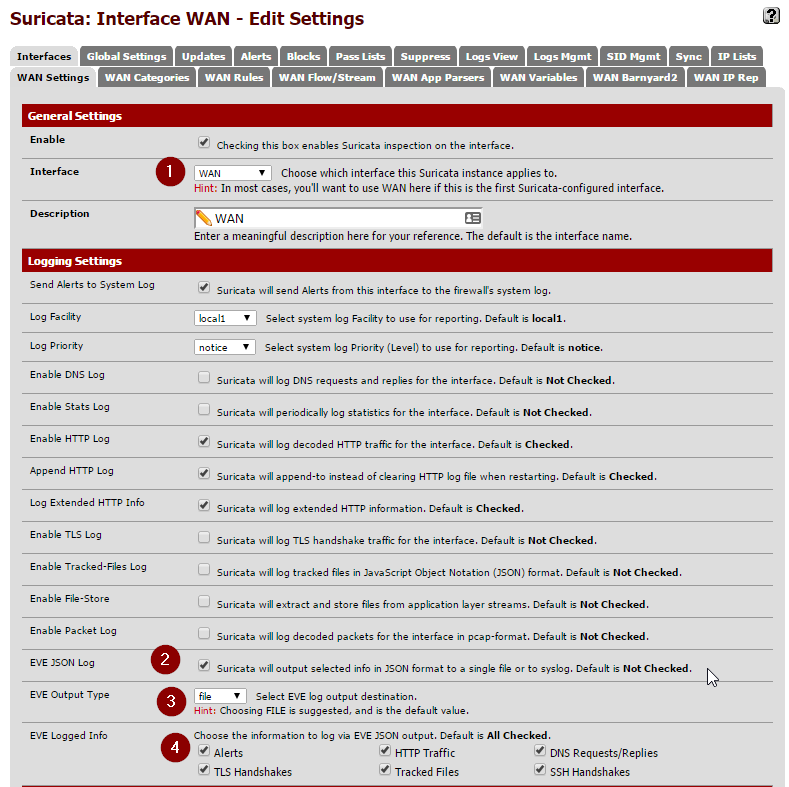
Pick your WAN interface in the drop down. The majority of the other settings can be left at their defaults. Now check off the EVE JSON Log setting. Make sure the Eve Output Type is left one "file" and all of the check boxes in Eve Logged Info boxes are checked off. For now, make sure both settings under Alert Settings are unchecked. This can be used to automatically kill sessions that match one of the rules we will be applying, but its best to let things run for a few days to ensure everything is operating as expected. Save the settings.
Now to apply the rules we downloaded to this interface. This is done in the Categories tab. When you open this section you should see all of the rules that were downloaded and extracted earlier. Simply hit the Select All then Save.
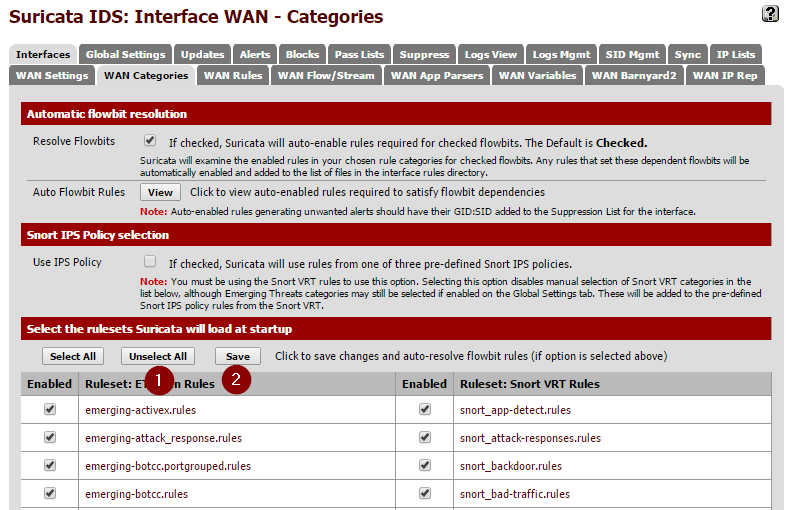
Next, check out the Rules section. This is where you can tweak which specific rules from the extract sets actually alert. For now you can just leave everything enabled. I did end up disabling rules under the decoder-events.rules and stream-event.rules. These seemed to create a lot of noise for things that didn't really appear to be issues related to low-level network behaviors. These events can be filtered from views in Kibana, but I found it easier just to disable them at the source.
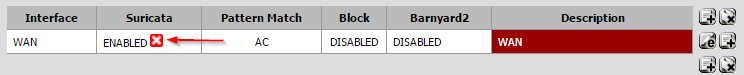
After everything is set, got back to the Interfaces page. If there is a red X in the Enabled section, click it to start inspection. It should to a green check mark after a few seconds.
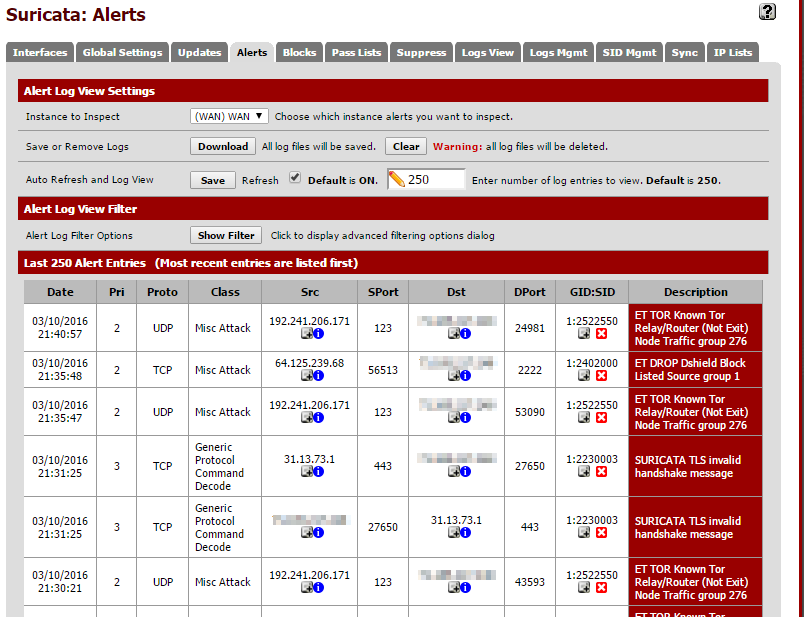
In few minutes, you should start to events that match an applied rule show up in the Alerts tab.
At this point, everything should be running that we need to on the Suricata side of things. Now its time to set up Filebeat to forward logs to an ELK server.
Filebeat Installation/Configuration
There is no official package from pfSense for Filebeat. In order to install it, you will need to manually download to package and set it to run on boot. This must be done from an shell session. If you have not already done so, enable SSH and get logged into the shell (8 from the main menu).
Find the package
Elastic does not officially release FreeBSD variants of Filebeat. Luckily their build system produces new releases automatically. You just have to find the latest release.
First, find the hash of the latest push to the master branch. I did this from another machine:
curl -XGET https://api.github.com/repos/elastic/beats/git/refs/heads/master
You will get a JSON array back. Look for the sha field under object.
{
  "ref": "refs/heads/master",
  "url": "https://api.github.com/repos/elastic/beats/git/refs/heads/master",
  "object": {
    "sha": "e84484e5b5dd09caf159f83c2c8359c5e988b3b4",
    "type": "commit",
    "url": "https://api.github.com/repos/elastic/beats/git/commits/e84484e5b5dd09caf159f83c2c8359c5e988b3b4"
  }
}
Now find the corresponding build on this page. You want the filebeat-freebsd-amd64 package. Copy the URL then fetch it right on your pfSense box.
cd ~
fetch https://beats-nightlies.s3.amazonaws.com/jenkins/filebeat/321-e84484e5b5dd09caf159f83c2c8359c5e988b3b4/filebeat-freebsd-amd64
Move filebeats to where we'll run it out of and ensure it is executable:
mkdir /etc/filebeat
mv ~/filebeat-freebsd-amd64 /etc/filebeat/
chmod +x /etc/filebeat/filebeat
Configure Filebeat
By default, Filebeat will look in its current directory for a configuration file called filebeat.yml. An example configuration can be found here. Ultimately we just need to ship any EVE files so the configuration will be fairly minimal, but first we need to find where those files are located. Generally, they seem to be located in /var/log/suricata/<interface_name>/eve.json but you can also locate them with:
find / -name "eve.json"
The contents of /etc/filebeat/filebeat.yml should be:
filebeat:
  prospectors:
    -
      paths:
        - /var/log/suricata/*/eve.json
      input_type: log
      document_type: SuricataIDPS
output:
  logstash:
    hosts: ["192.0.2.15:5044"]
Replace hosts with the IP address or host name of your Logstash server. Remember that white space is significant in YAML and tabs are not allowed. This is about as simple a configuration that you can get away with but there is much more that can be configured from here. Make note of the document_type field, which will be used in some Logstash filters later. Test for syntax errors with:
/etc/filebeat/filebeat -configtest
It will return nothing if the config file is properly formatted.
Set Filebeat To Start Automatically
The easiest way to set Filebeat to start at boot is to add a shellcmd to pfSense's config. Per the official documentation there are two ways to accomplish this: manually editing the config or via an installable package. I had a lot of issues when doing it manually, so the package route seems like the better way to go.
Navigate to System, Packages in the pfSense menu and locate the Shellcmd package. Click on the Plus sign on the right to kick off the install. Once complete, the package can be configured via the Services menu. Click the plus sign to add a new command. In the Command box enter /etc/filebeat/filebeat. Leave the type box as shellcmd. Save the configuration. You will need to restart for Filebeat to begin running in the background.
Logstash Configuration
Now we're going to jump over to the ELK server. Before we get into the actual configuration, let's grab a geolocation dataset that we be useful for mapping IP addresses to locations on a map. I generally just store it in the Logstash directory:
cd /etc/logstash
wget http://geolite.maxmind.com/download/geoip/database/GeoLiteCity.dat.gz
gzip -d GeoLiteCity.dat.gz
Logstash configurations consists of three parts:
- An input, where to accept the stream for the log. In our case it will be a port to receive the Filebeat traffic.
- A filter, used to transform the data so that it is ready to be placed in the output source. Since Suricata is already outputting JSON the only thing that is really being done is a look up of the IP address against the geolocation database we downloaded earlier.
- An output, where to store the data. In this case, the Elasticsearch instance.
All of these could be defined in a single file but it is much more manageable to split them into separate files. Create and populate the following under /etc/logstash/conf.d:
Input file:
01-beatin.conf
input {
  beats {
    port => 5044
    codec => json
  }
}
Filter (make sure the path to the geo data matches):
10-suricata.conf
filter {
  if [type] == "SuricataIDPS" {
    date {
      match => [ "timestamp", "ISO8601" ]
    }
    ruby {
      code => "if event['event_type'] == 'fileinfo'; event['fileinfo']['type']=event['fileinfo']['magic'].to_s.split(',')[0]; end;"
    }
  }

  if [src_ip]  {
    geoip {
      source => "src_ip"
      target => "geoip"
      #database => "/etc/logstash/GeoLiteCity.dat"
      add_field => [ "[geoip][coordinates]", "%{[geoip][longitude]}" ]
      add_field => [ "[geoip][coordinates]", "%{[geoip][latitude]}"  ]
    }
    mutate {
      convert => [ "[geoip][coordinates]", "float" ]
    }
    if ![geoip.ip] {
      if [dest_ip]  {
        geoip {
          source => "dest_ip"
          target => "geoip"
          #database => "/etc/logstash/GeoLiteCity.dat"
          add_field => [ "[geoip][coordinates]", "%{[geoip][longitude]}" ]
          add_field => [ "[geoip][coordinates]", "%{[geoip][latitude]}"  ]
        }
        mutate {
          convert => [ "[geoip][coordinates]", "float" ]
        }
      }
    }
  }
}
Output:
30-elasticout.conf
output {
  elasticsearch {
    host => localhost
  }
}
Now check the configuration, on Ubuntu 14.04 it is done with the following command:
service logstash configtest
The command should return Configuration OK if everything is good. Restart Logstash with service logstash restart to make sure it picked up the configuration changes.
You should now be able to see the events from Suricata in Kibana:
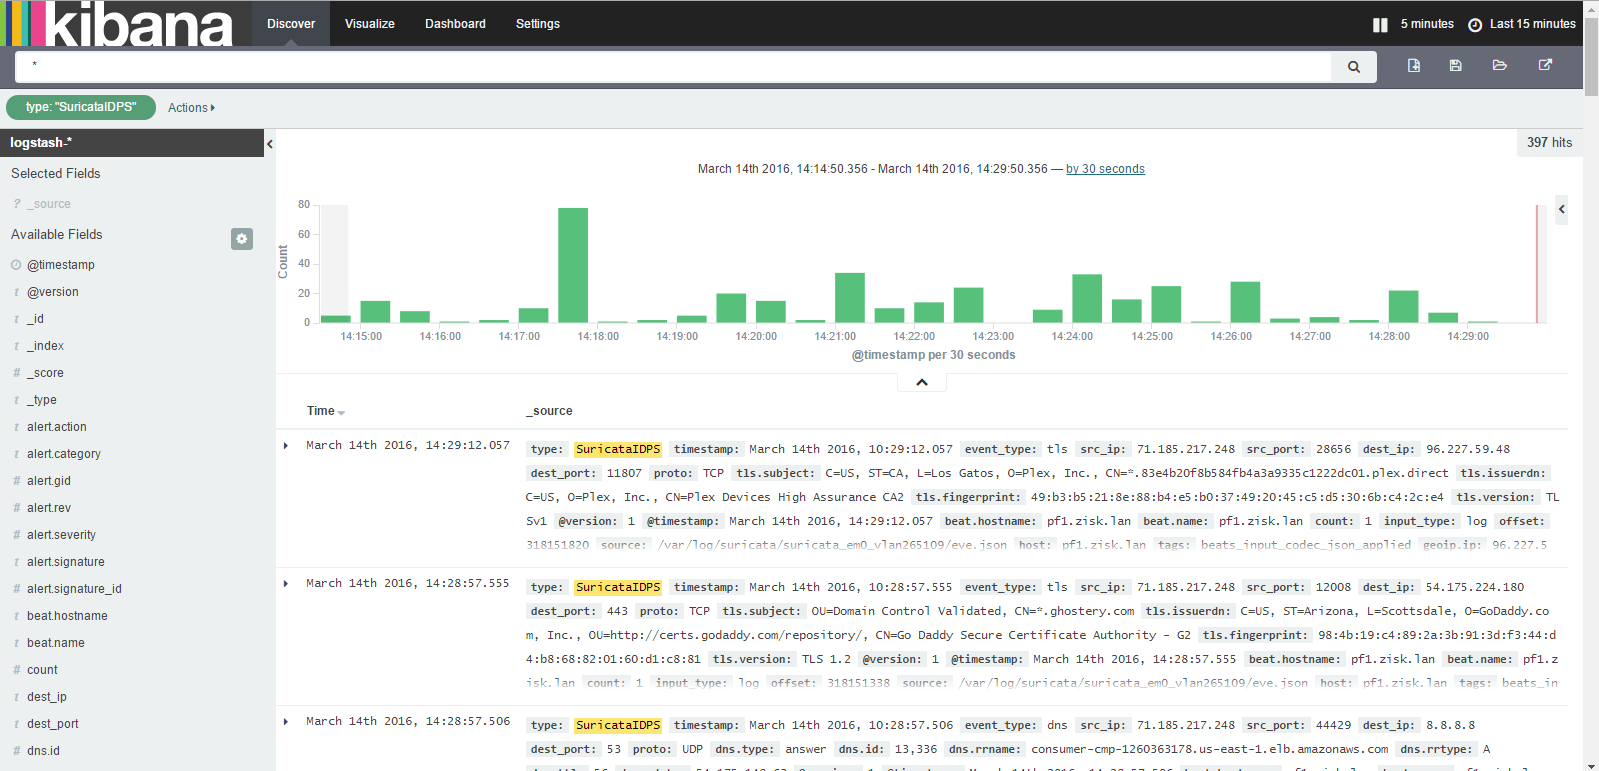
With the default configuration there is quite a bit logged since DNS and TLS connects are both included, but these can be filtered out by setting the event_type to alert.
Notes
-
I did not set up any security for Filebeats during this tutorial, but it is recommended that you set up encryption, which is detailed in the DigitalOcean tutorial above. Elastic also makes a product called Shield, which I have not tried yet but is used for securing various parts of the ELK stack.
-
I don't know if its necessary but I did set up Logrotate to cycle the EVE files when they get too large. This can be installed using the
pkgcommand on pfSense. I used the following config and setup a daily cronjob:
/var/log/suricata/*/eve.json {
        size 500M
        rotate 0
        missingok
        postrotate
                killall -HUP suricata
        endscript
}
- I have not set up any sort of maintenance on the Elasticsearch instance so records will keep getting added until it fills the disk. I am going to look at Curator for this.